Dashboard
The NetSupport ServiceDesk dashboard provides Operators with on-line up-to-the-minute status reports. Pre-defined categories are supplied and you simply choose the appropriate items to include. Multiple categories can be selected simultaneously and the on-screen results are refreshed at intervals to suit your requirements.
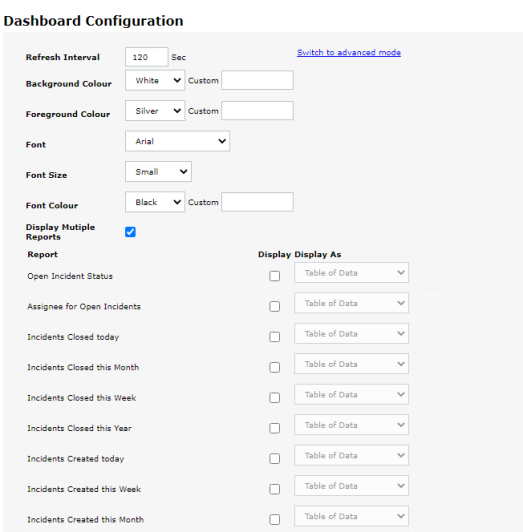
Dashboard Configuration dialog
To use the reports dashboard
-
Select the Reports tab and click the Dashboard icon in the toolbar. The Dashboard Configuration window appears.
-
Set the refresh interval or use the 120-second default. This determines how quickly the dashboard cycles through each report.
-
Choose the display settings, background/foreground colours, font, font size and colour.
-
Choose to display all reports on one page or the dashboard will cycle through individual reports.
-
Select the pages to include. Multiple pages can be selected, the system will cycle through each item based on the selected refresh interval.
-
Choose how you want the information displayed, as a table, pie chart or bar chart.
-
Click Display to launch the Dashboard. Reports are displayed full-screen.
-
Click when ready to leave the Dashboard.
For a more permanent record NetSupport ServiceDesk provides you with the ability to create custom reports based on a previous search.
See also:
 Download manual

